Malicious Traffic Analysis - Examining a "pcap" File with Wireshark
Malicious Traffic Analysis is a form of analysis that aims to detect abnormal network behavior that differs from what activity should look like, by examining…

Malicious Traffic Analysis
This is a form of analysis that aims to detect abnormal network behavior — activity that differs from what it should be — by examining the network activity occurring within a network.
To thoroughly examine the security of networks and to understand network issues, it’s necessary to be able to inspect both internal and external traffic on the network.
Network traffic and packet analysis involve using various tools to read and interpret packets captured on network traffic, evaluate that traffic, be well versed in various protocols, and detect anomalies. This way, it aims to help both identify network performance issues and detect and block attacks within network traffic.
Analysis Tools
Due to their multi-purpose use, network analysis software is a very important component of a comprehensive network performance management system. What these software tools are and their primary purposes are as follows;
- Ensuring Security;
Data packets can serve as an important component of network security monitoring. These analysis tools help you automate and visualize traffic patterns, so you can identify security threats as soon as they emerge.
For example, packet capture analysis shows real-time network traffic data, which can reveal a rapid spike in unauthorized activity.
- Finding Congestion;
Packet sniffing gives you a real-time view of your data’s travel times, which can help you identify traffic congestion.
- Troubleshooting;
Once you’ve flagged a network problem through your troubleshooting analysis, the detailed size of each packet can be examined to determine the source of the problem. Even if you only capture metadata, you can track the important details of unusual packets for effective troubleshooting.
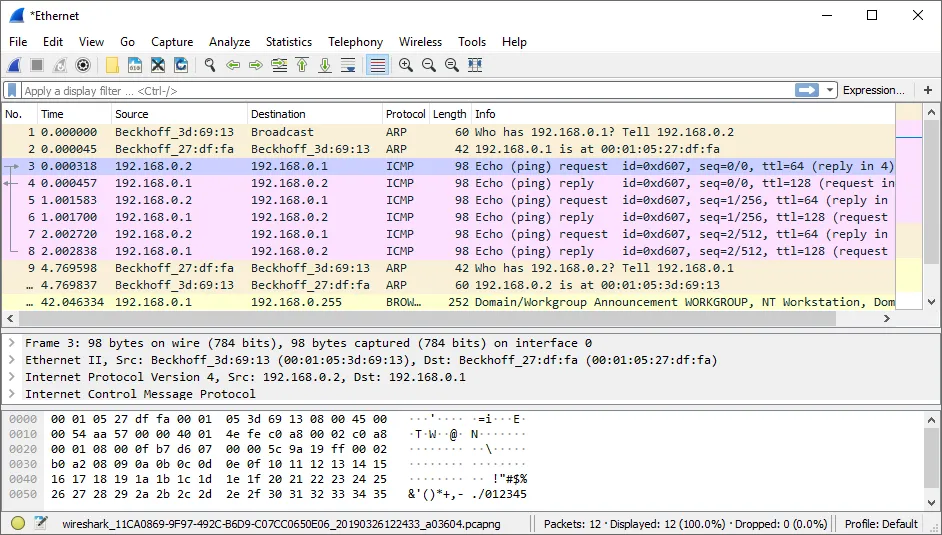
1- Wireshark
Wireshark is a free and open-source network traffic analysis tool. It’s generally used to inspect packets flowing over the network, but it can also be used to extract files from network traffic captures.
To extract a file from Wireshark, you need to know how it was transferred over the network.
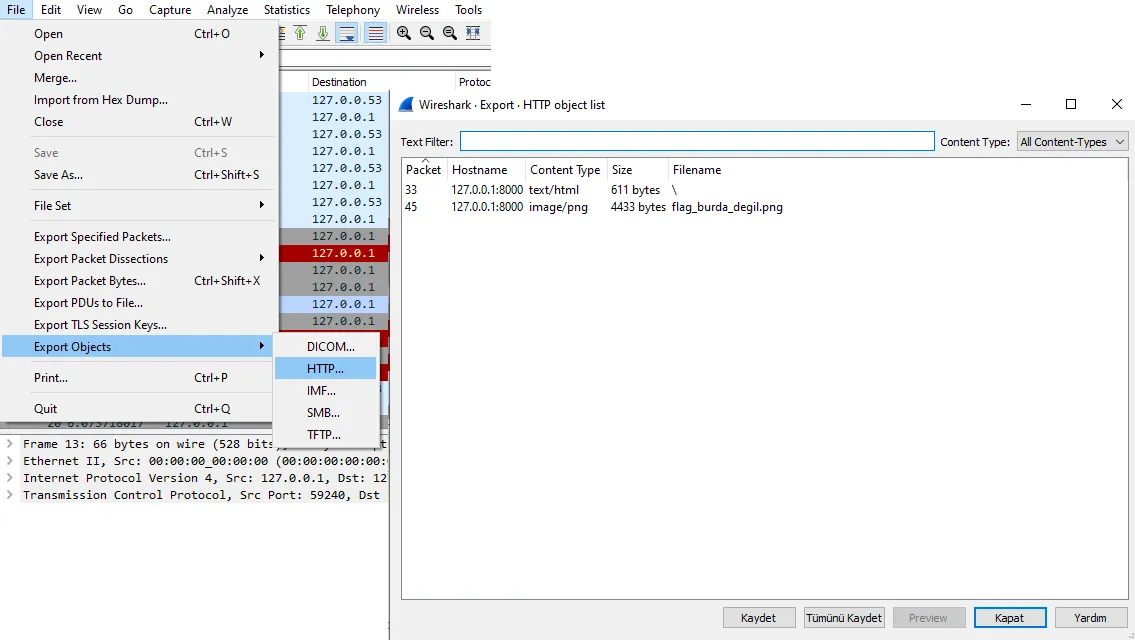
For example, a malware sample might be retrieved using an HTTP GET request. Once the protocol is known, files can be extracted via File → Export Objects →
2- NetworkMiner
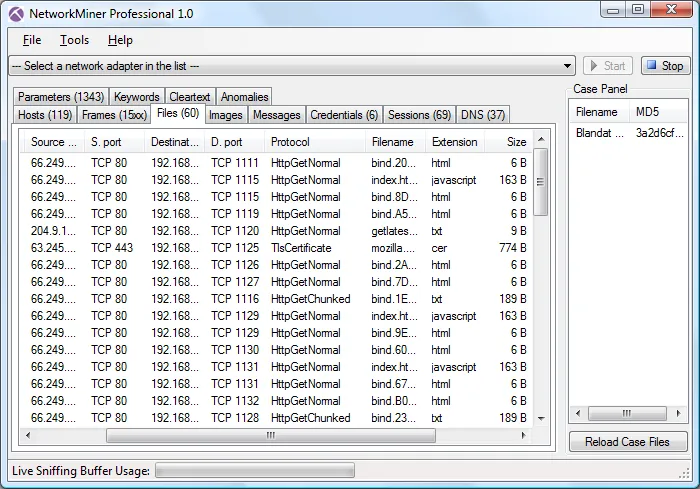
NetworkMiner is a network traffic analysis tool produced by NETRESEC. A free or paid version is available from their website. Unlike Wireshark, NetworkMiner isn’t designed for examining individual packets one by one. Instead, it makes it easy for an analyst to extract a large amount of specific information from a packet capture. Another difference between NetworkMiner and Wireshark is that, although it shows less of all the inbound/outbound packets, it allows for a more detailed examination.
NetworkMiner also automatically extracts and reconstructs files found in network traffic captures. They’re placed in the Assembled Files folder within NetworkMiner’s directory. This makes NetworkMiner one of the best tools available for extracting files from network traffic captures.
3- TShark
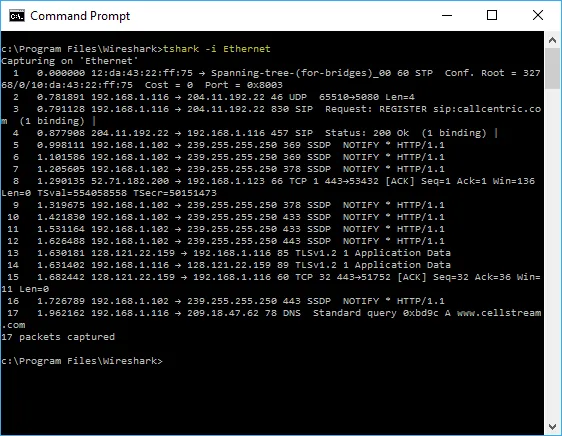
TShark is a command-line network traffic analyzer that lets you capture packet data from a live network or read packets from a previously saved capture file. Without any options, TShark behaves similarly to the tcpdump command. In addition, TShark can detect, read, and write the same capture files supported by Wireshark.
As shown below, it can be run from the command line.
4- TCPdump
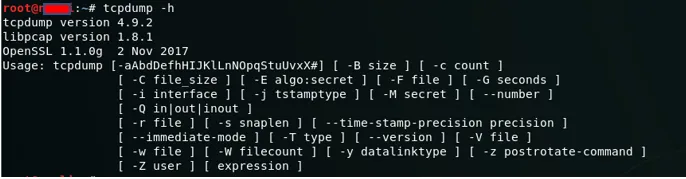
Tcpdump is a general-purpose packet analysis tool that runs from the command line. It offers the ability to record, inspect, and filter TCP/IP packets, or other packets, transmitted or received over a network the user’s computer is connected to.
Tcpdump comes preinstalled on Linux systems. It generally doesn’t come preinstalled on other operating systems. Tcpdump uses the “libpcap” library to capture packets.
The Windows equivalent of Tcpdump is called WinDump, and it uses WinPcap, which is the Windows port of libpcap.
Situations That Can Indicate Malicious Activity
The network monitoring tools mentioned above are used to identify cases of malicious activity. Many different situations can indicate malicious activity, so it would be somewhat inaccurate to say specific situations can be flatly categorized as malicious activity. However, you can review the situations below to understand the general logic.
- Server Requests
Requests continually made from the same IP addresses to services running on servers may be aiming to carry out malicious activity.
The goal here is for the attacker to repeatedly make requests targeting the port used by a single service.
- Port Requests
Different port requests continually coming from a specific or varying address can be malicious activity.
For example, an attacker sending requests both to active, running services on the server itself and to inactive ports can be considered malicious activity. In other words, this can also be thought of as brute-forcing ports.
- Man-in-the-Middle Attacks
Traffic can be inspected for attacks where an attacker intercepts and alters communication between two endpoints communicating with each other, such as ARP Poisoning attacks.
- Failed Sessions
Requests continually coming from the same IP address to specific admin panels can indicate a Brute Force attempt. As a result, this should be treated as, and tracked as, malicious activity.
Simple Malicious Traffic Analysis
This section provides a simple, visual walkthrough of how the areas that can be examined or checked during network traffic analysis are reviewed. For this section, I found a “pcap” file online and examined it.
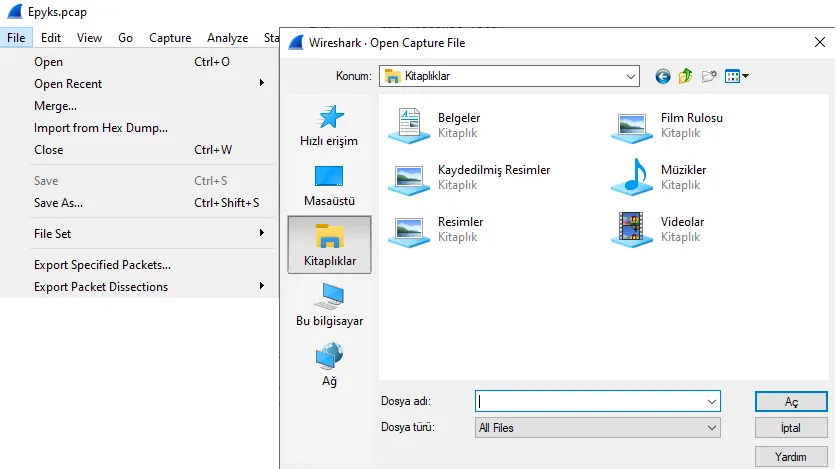
- First, we import a “pcap” file as follows. A pcap file is a file extension used for saving and reviewing captures from network analysis tools.
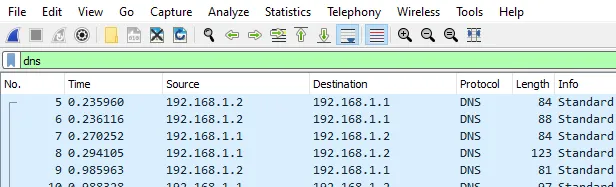
- Here, we can examine protocols by typing the name of the protocol we want to inspect into the search field shown in green.
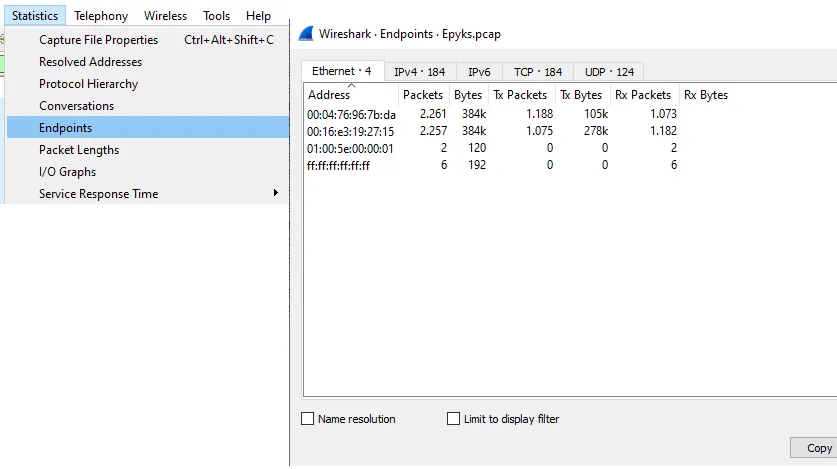
- Here, from the “Statistics” option, under “endpoints”, we can get information about the endpoints and examine them in detail.
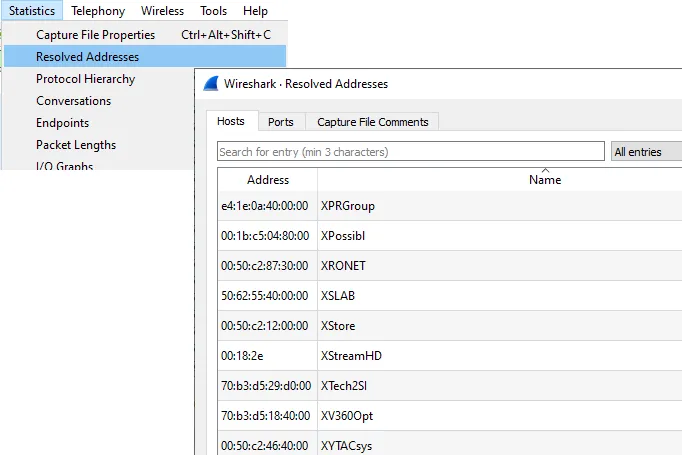
- Also under the Statistics option, “Resolved Addresses” lets you view the resolved addresses of devices.
- Traffic can be examined in detail. The details of the data exchange over a TCP flow, from its starting point to its endpoint, can be viewed via TCP stream.
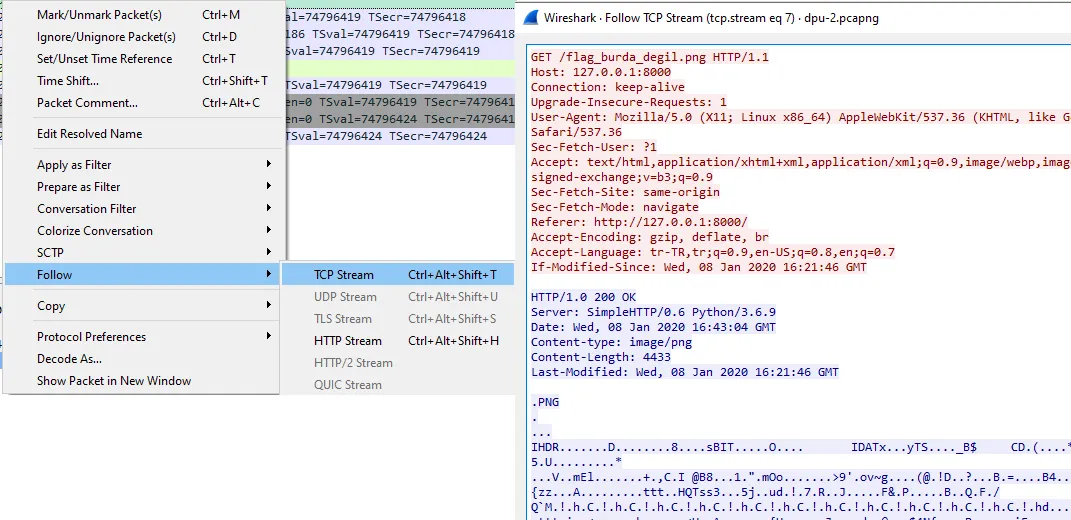
-
Inbound/outbound binary files transferred as part of HTTP and similar requests within the traffic can be exported by the applications that capture the network traffic.
-
Here, exporting files transferred over protocols like HTTP and TFTP using the Export Objects option is demonstrated.
Thanks for reading this far :)